


For various reasons related to work, study, leisure and family, people are sleeping less and less. Not only that, but the rate of sleep disorders in megalopolises like São Paulo is extremely high. Results from EPISONO, an epidemiological study that tracks sleep complaints and disorders in the city of São Paulo, indicate that around 45% of the population has some complaint of insomnia or difficulty sleeping (CASTRO; POYARES; LEGER; BITTENCOURT et al., 2013), and 33% of the population has obstructive sleep apnea (TUFIK; SANTOS-SILVA; TADDEI; BITTENCOURT, 2010). Furthermore, even if we consider healthy individuals without sleep disorders, natural aging leads to a reduction in total sleep time and sleep quality, characterized by greater fragmentation of the sleep period (VAN CAUTER; LEPROULT; PLAT, 2000). Therefore, considering the magnitude of people affected by poor quality and insufficient duration of sleep, the aim of this article is to elucidate the relationships between sleep, sleep deprivation/restriction and metabolism.
Reghormone therapy
During sleep, several important reactions take place in the body. Specifically, during slow-wave sleep there is a reduction in blood pressure and heart rate, a reduction in the sympathetic activity of the central nervous system and an increase in parasympathetic activity (SOMERS; DYKEN; MARK; ABBOUD, 1993), as well as reduced glucose metabolism (ZOCCOLI; WALKER; LENZI; FRANZINI, 2002). In addition, the release of hormones from the hypothalamic-pituitary-adrenal axis, such as cortisol, is inhibited, while the release of growth hormone (GH) and prolactin is increased (FRIESS; WIEDEMANN; STEIGER; HOLSBOER, 1995). Both hormones, GH and cortisol, have an important impact on glucose regulation. Aging reduces the proportion of slow-wave sleep, and this reduction is associated with a reduction in GH secretion between youth and middle age, as well as between middle age and senescence, and this reduction in GH secretion was associated with a reduction in slow-wave sleep regardless of age. In 2011, Le Proult and Van Cauter demonstrated the effect of one week of sleep restriction on serum testosterone levels in 10 healthy adult men (LEPROULT; VAN CAUTER, 2011). The results showed that testosterone levels were reduced by 10 to 15% compared to baseline levels after the period of sleep restriction of 5 hours per night. Furthermore, this reduction was correlated with lower levels of vigor. By way of comparison, natural ageing results in a reduction in testosterone levels of between 1 and 2% per year. Considering that the symptoms of androgen deficiency include low energy levels, reduced libido, concentration problems and increased sleepiness, this becomes a major problem in the population.
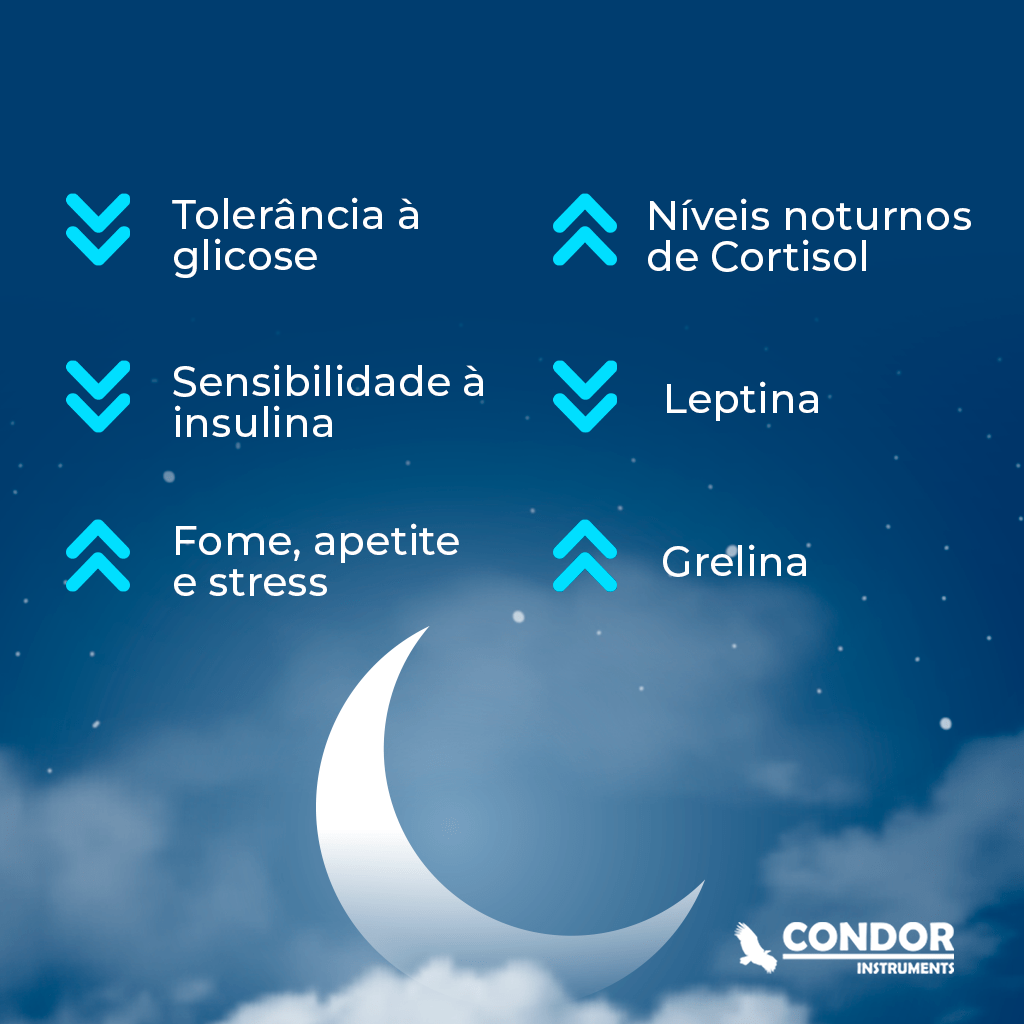
Considering these facts, it is to be expected that the impact on glucose regulation will have negative consequences for the body. During periods of sleep restriction, there is a significant reduction in glucose tolerance compared to periods of total rest (SPIEGEL; LEPROULT; VAN CAUTER, 1999). Evidence indicates that reduced slow-wave sleep in healthy individuals leads to reduced insulin sensitivity, reduced glucose tolerance and an increased risk of developing type II diabetes (TASALI; LEPROULT; EHRMANN; VAN CAUTER, 2008). These data are corroborated by epidemiological studies indicating that individuals who sleep less are more at risk of developing diabetes. A 10-year prospective study evaluated 70,026 women and showed that volunteers who slept 5 hours or less per night had a higher risk of developing diabetes than volunteers who slept 8 hours per night (AYAS; WHITE; AL-DELAIMY; MANSON et al., 2003).
Sleep duration and appetite regulation
Food intake is regulated by the neuroendocrine system. The hormone leptin has an inhibitory effect on food intake (satiety) and increases calorie expenditure (SCHWARTZ; MORTON, 2002). On the other hand, ghrelin is a hormone secreted by the stomach that stimulates appetite. Under healthy conditions, ghrelin levels increase just before meals and are reduced just after eating. Studies show that chronic sleep restriction is associated with a reduction in leptin levels and an increase in ghrelin levels (SPIEGEL; TASALI; PENEV; VAN CAUTER, 2004). In addition, an increase in the ghrelin/leptin ratio is correlated with greater appetite, especially for carbohydrate-rich foods (SPIEGEL; TASALI; PENEV; VAN CAUTER, 2004). Finally, the reduction in leptin levels observed after sleep restriction is similar to the reduction observed after energy restriction of 70% (reduction in leptin levels of 26% and 22%, respectively).
Finally, researchers in the field agree that the increase in population obesity rates cannot be explained solely by eating habits and physical exercise. Population studies involving almost a thousand adults (CHAPUT; DESPRÉS; BOUCHARD; TREMBLAY, 2007) and 10,000 children (SEKINE; YAMAGAMI; HANDA; SAITO et al., 2002) indicate that total sleep time is an important risk factor for developing obesity. Evidence indicates that levels of adiposity and obesity are reduced in individuals who sleep 7-8 hours a night, compared to those who sleep 5-6 hours (CHAPUT; DESPRÉS; BOUCHARD; TREMBLAY, 2007).
Conclusion
Scientific evidence indicates that sleep is important for regulating various metabolic processes, so that sleep restriction increases the likelihood of developing metabolic diseases such as diabetes and obesity. These deleterious effects occur through various factors, including the imbalance between the key hormones for appetite regulation: leptin and ghrelin, as well as changes in glucose metabolism. Considering these observed losses, it is important that individuals are made aware of the importance of sleep, as well as receiving support to develop strategies to positively modify the quality and duration of sleep.
Sleep pattern assessment
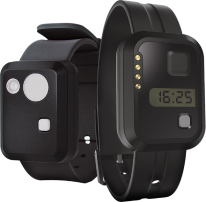
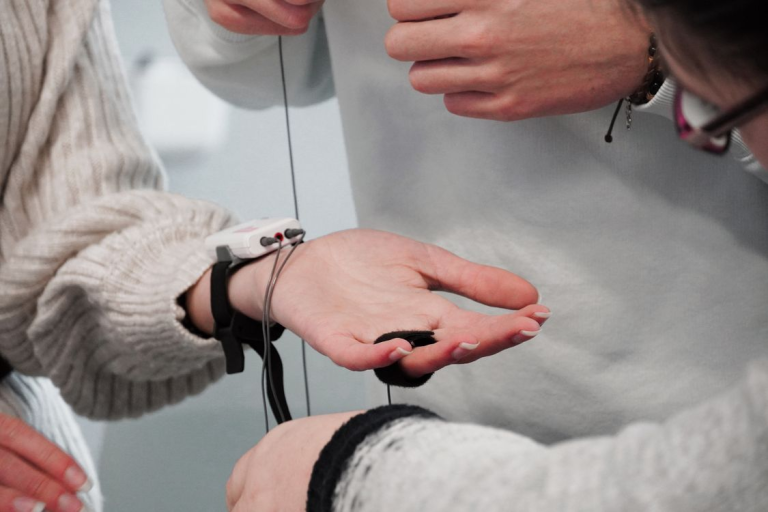
Actigraphy is a non-invasive technique that can be used to assess sleep patterns and the sleep-wake rhythm. The actigraph is a device similar to a wristwatch that contains light, movement and temperature sensors. Using this information, it is possible to extract data on variables such as total sleep time, sleep onset latency, time awake after sleep onset, sleep efficiency, time awake and rhythm-related variables such as cosinor, spectrogram, periodogram and non-parametric variables such as L5, M10, IS and IV.