

Why energy expenditure needs actigraphy
Estimating physical activity levels is expensive and technically demanding. The gold standard for energy expenditure is the doubly labelled water (DLW) technique, but its cost, complexity and poor scalability make it impractical for most field research. Doubly labelled water tracks total energy turnover over days but cannot say when someone was active, how intense the activity was, or how it was distributed across the sleep–wake cycle. Indirect calorimetry measures energy expenditure directly, yet it confines participants to a laboratory chamber or face mask. Actigraphy — the measurement of movement across days — offers a way to capture that distribution in the field.
Accelerometry is the practical alternative: small, wearable and scalable. A sensor worn on the hip or wrist converts movement into activity counts, and those counts can be turned into a continuous, around-the-clock picture of physical activity. The open question is how faithfully those raw counts estimate true energy expenditure — the construct that actually connects movement to health. Public health guidance, for example the World Health Organization recommendation of 150–300 minutes of moderate-intensity aerobic physical activity per week, depends on being able to measure not just whether people move but how much energy that movement costs.
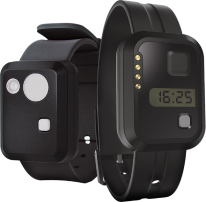
In this study, researchers in Brazil addressed that gap for ActTrust®. They validated the device against indirect calorimetry and against one of the most established research accelerometers on the market — the ActiGraph® GT3X+ — and they built a model that pushes actigraphy one step closer to being a stand-in for laboratory energy expenditure in the field.
What the study did
The team recruited 56 young adults (34 men, 22 women, aged 18–35) and measured energy expenditure with indirect calorimetry using a Quark CPET metabolic cart (Cosmed, Italy) while participants walked and ran on a treadmill at controlled intensities spanning light, moderate, vigorous and very vigorous effort. Each participant wore an ActTrust® device and an ActiGraph® GT3X+ simultaneously, with devices positioned at the hip and at the wrist so that both placements could be compared against the same calorimetry reference. Oxygen uptake was recorded breath-by-breath throughout, and the cart was calibrated before each test with a known gas mixture. The work was led by Elias dos Santos Batista, Mario André Leocadio-Miguel, and colleagues.
From the raw acceleration the authors derived movement counts, then compared them against metabolic equivalents (METs) computed from oxygen uptake. With those measurements they fitted a linear model to estimate energy expenditure from movement counts, and then derived cut-off values that classify the intensity of physical activity into standard MET bands. The full author list is in the reference below.
Methodologically this matters because it treats the device as a quantitative instrument. A researcher’s job is not simply to know whether a participant moved, but to estimate how much energy that movement cost and at what intensity it was performed. Reporting a reusable set of thresholds — rather than a single headline correlation — is what lets other groups apply the same model to their own cohorts.
Results: from movement counts to METs
Treadmill speed predicted measured METs with a correlation of r = 0.95. Movement counts from the GT3X+ and ActTrust® both tracked that relationship closely on the hip (r = 0.94 and r = 0.93) and at the wrist (r = 0.88 for both devices). These are correlations between two measures that share a common driver — treadmill effort — so the practical test is not the correlation itself but whether the modelled energy expenditure reproduces the measured values well enough to be useful.
The proposed linear model classified physical activity intensity with balanced accuracy above 0.77 across all intensity ranges, and above 0.9 for light and moderate activity. Balanced accuracy is a sensible benchmark here because physical activity intensity data are typically unbalanced — most people spend far more time in light and moderate bands than in vigorous ones, so a classifier that only guessed the majority class would look good on plain accuracy. Reporting balance averages the sensitivity and specificity across bands and is stricter.
Bland–Altman analysis found no evidence of systematic proportional bias between model-predicted and measured METs across the measured range — an important null result, because it suggests the model does not drift away from the truth as intensity rises, and that the 95% limits of agreement stay stable across the range of walking and running speeds tested.
Reassuringly, the hip and the wrist told a broadly similar story. That matters practically: many actigraphy protocols already fix a placement to answer a different question, and it is useful to know that energy-expenditure modelling is not hostage to that choice.
Proposed intensity thresholds
Following the conventional MET-band framework, the authors report cut-off values that separate four physical activity intensities: light [0,3), moderate [3,6), vigorous [6,9), and very vigorous [9,∞) METs. These thresholds let a researcher examine how much walking people do, distinguish walking from running, and quantify time spent in each intensity band over days of recording.
| Intensity | MET band | Typical example |
|---|---|---|
| Light | [0, 3) | Slow walking, light household activity |
| Moderate | [3, 6) | Brisk walking, cycling |
| Vigorous | [6, 9) | Running, vigorous sport |
| Very vigorous | [9, ∞) | Intense running or training |
Because the model was built from movement counts at either the hip or the wrist, an investigator can keep a recording placement that suits their protocol and still obtain a defensible estimate of time in each intensity band.
Caveats and limitations
The study should be read with a few caveats in mind. First, the sample is a relatively small cohort of healthy young adults, so the thresholds should be re-checked in other populations before being generalised to children, older adults or clinical groups. Second, the effort protocol used a treadmill; the relationship between movement counts and energy expenditure may differ for other forms of activity, such as resistance training or daily-life movement patterns. Third, the authors note that the condition sequence was not fully counterbalanced, which could in principle allow progressive fatigue or warm-up adaptation to influence results.
None of these limitations undercut the central result. For the range tested, ActTrust® produced movement counts closely related to measured energy expenditure, and the derived thresholds classified intensity with high balanced accuracy. The absence of proportional bias is one of the more reassuring specifics in the paper: the agreement between modelled and measured METs did not deteriorate as intensity increased.
What this means for researchers
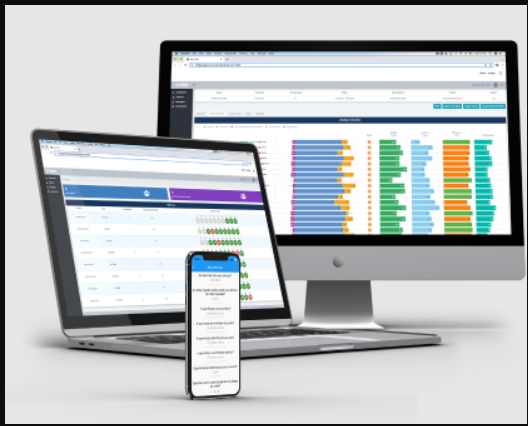
According to the authors, this is the first study to model and validate physical activity intensity thresholds specifically for ActTrust®. Led by Mario André Leocadio-Miguel and colleagues, the work gives study teams in sleep, circadian and chronobiology research a wearable that contributes to a continuous 24-hour picture: movement and its energy cost, alongside the light and temperature channels the platform already records and the analysis tools in ActStudio.
Because the model runs on movement counts at either the hip or the wrist, researchers can pick a placement that suits their protocol without giving up a defensible link to energy expenditure. And because the thresholds are published with the paper, they can be applied, compared and re-validated by other groups — which is how a measurement instrument earns trust.
For a practical picture of what a device like ActTrust® records during a study — acceleration, ambient light, skin and environment temperature, and the rest-activity rhythm that emerges from them — the ActLumus product page and the ActStudio software describe how raw channels are turned into inspectable, exportable signals. Pairing a validated energy-expenditure model with existing sleep and circadian outputs lets a single recording describe both the timing of behaviour and its energetic cost. A researcher who already standardises light dosimetry on an ActLumus and rest-activity on an ActTrust 2 can begin to connect those measurements to the cost of movement as well.
Replicating this design in children, older adults and clinical populations remains the natural next step, and each replication is also a chance to confirm or refine the published thresholds. Recording placement, sample size, and the intensity distribution of the activity protocol are the variables most likely to matter in those replications.
Reference
dos Santos Batista E, Basilio Silva Gomes SR, de Morais Ferreira AB, França LGS, Fontenele Araújo J, Mortatti AL, Leocadio-Miguel MA. From movement to METs: A validation of ActTrust® for energy expenditure estimation and physical activity classification in young adults. PLOS ONE. 2026;21(5):e0348631. doi:10.1371/journal.pone.0348631.